Datasheet
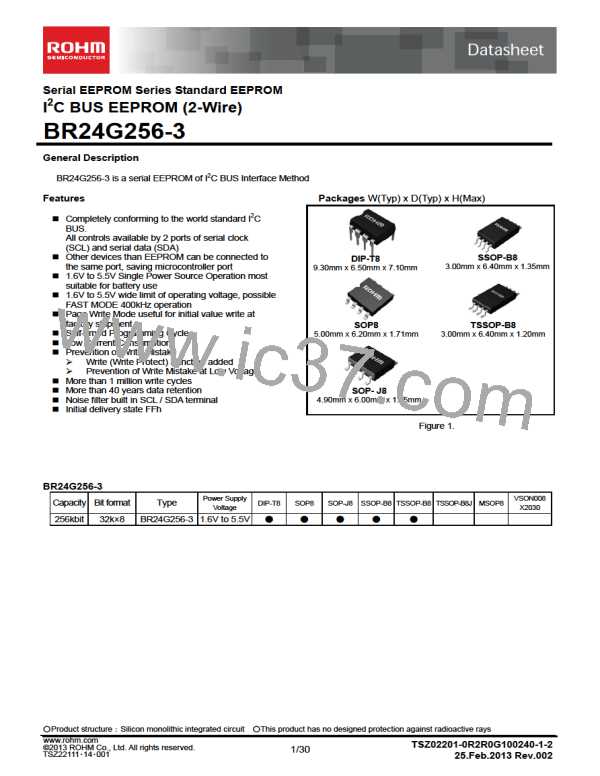
BR24G256-3
Typical Performance Curves
6
5
4
3
2
1
0
6
Ta=-40
Ta= 25
Ta= 85
Ta=-40
℃
℃
Ta= 25
℃
℃
℃
5
Ta= 85
℃
4
3
2
1
0
SPEC
SPEC
0
1
2
3
4
5
6
0
1
2
3
4
5
6
Supply Voltage : Vcc(V)
Supply Voltage : Vcc(V)
Figure 5. Input Low Voltage1,2 vs Supply Voltage
(A0, A1, A2, SCL, SDA, WP)
Figure 4. Input High Voltage1,2 vs Supply Voltage
(A0, A1, A2, SCL, SDA, WP)
1
1
0.8
0.6
0.4
0.2
0
Ta=-40
Ta= 25
Ta= 85
℃
℃
℃
Ta=-40
℃
Ta= 25
Ta= 85
℃
0.8
0.6
0.4
0.2
0
℃
SPEC
SPEC
0
1
2
3
4
5
6
0
1
2
3
4
5
6
Output Low Current : IOL(mA)
Output Low Current : IOL(mA)
Figure 6. Output Low Voltage1 vs Output Low Current
(Vcc=2.5V)
Figure 7. Output Low Voltage2 vs Output Low Current
(Vcc=1.6V)
www.rohm.com
TSZ02201-0R2R0G100240-1-2
25.Feb.2013 Rev.002
©2013 ROHM Co., Ltd. All rights reserved.
5/30
TSZ22111・15・001

 ROHM [ ROHM ]