PE43704
Product Specification
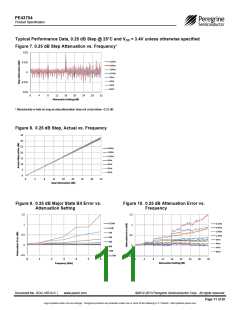
Typical Performance Data, 0.25 dB Step @ 25°C and VDD = 3.4V unless otherwise specified
Figure 7. 0.25 dB Step Attenuation vs. Frequency*
0.25
0.2GHz
0.125
0.9GHz
1.8GHz
0
2.2GHz
3GHz
4GHz
‐0.125
5GHz
6GHz
‐0.25
0
4
8
12
16
20
24
28
32
Attenuation Setting (dB)
* Monotonicity is held so long as step-attenuation does not cross below –0.25 dB
Figure 8. 0.25 dB Step, Actual vs. Frequency
35
30
25
0.9GHz
1.8GHz
20
2.2GHz
15
3GHz
10
5
4GHz
5GHz
6GHz
0
0
4
8
12
16
20
24
28
32
Ideal Attenuation (dB)
Figure 9. 0.25 dB Major State Bit Error vs.
Attenuation Setting
Figure 10. 0.25 dB Attenuation Error vs.
Frequency
1.5
1.5
0.25dB
0.5dB
1dB
0.2GHz
0.9GHz
1.8GHz
2.2GHz
3GHz
1
1
0.5
0
0.5
0
2dB
4dB
4GHz
8dB
5GHz
16dB
31.75dB
6GHz
‐0.5
‐0.5
0
1
2
3
4
5
6
0
4
8
12
16
20
24
28
32
Attenuation Setting (dB)
Frequency (GHz)
Document No. DOC-16514-6 |
www.psemi.com
©2012-2013 Peregrine Semiconductor Corp. All rights reserved.
Page 11 of 20
Logo updated under non-rev change. Peregrine products are protected under one or more of the following U.S. Patents: http://patents.psemi.com

 PSEMI [ Peregrine Semiconductor ]