TDA8931
Philips Semiconductors
Power comparator 1 × 20 W
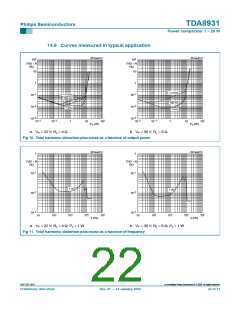
14.6 Curves measured in typical application
001aab813
001aac013
2
2
10
10
THD + N
THD + N
(%)
(%)
10
10
1
1
f = 6 kHz
−1
−1
f = 6 kHz
100 Hz
10
10
100 Hz
1 kHz
−2
−2
10
10
1 kHz
−3
−3
10
10
−2
−1
2
−2
−1
2
10
10
1
10
10
10
10
1
10
10
P
(W)
P (W)
o
o
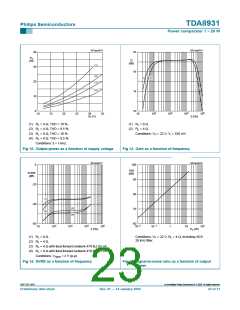
a. VP = 22 V; RL = 4 Ω.
b. VP = 30 V; RL = 8 Ω.
Fig 10. Total harmonic distortion-plus-noise as a function of output power
001aac014
001aac015
1
1
THD + N
THD + N
(%)
(%)
−1
−1
10
10
1 W
1 W
−2
−2
10
10
−3
−3
10
10
2
3
4
5
2
3
4
5
10
10
10
10
10
10
10
10
10
10
f (Hz)
i
f (Hz)
i
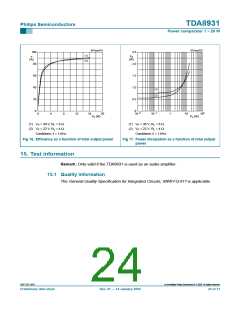
a. VP = 22 V; RL = 4 Ω; Po = 1 W.
b. VP = 30 V; RL = 8 Ω; Po = 1 W.
Fig 11. Total harmonic distortion-plus-noise as a function of frequency
9397 750 13847
© Koninklijke Philips Electronics N.V. 2005. All rights reserved.
Preliminary data sheet
Rev. 01 — 14 January 2004
22 of 31

 NXP [ NXP ]