Freescale Semiconductor, Inc.
positively skewed distributions. A right skewed distribution will
A media test typically needs to take results received in
weeks or months to predict lifetime in years. Acceleration
models are used to determine the relationship between the
accelerated test and the normal lifetime. Literature has
reported numerous models to equate testing to lifetime
including the Peck model for temperature and humidity [25].
TheaccelerationequationbasedonPeck’smodeliswhereEa
is 0.9eV and n is –3.0. The value K is Boltzmann’s constant
be a good model for data in a histogram with an extended right
tail. The Weibull distribution is sometimes referred to as a
distribution of minima. An example of a Weibull distribution is
the strength to break a chain where the weakest link describes
the strength of the chain. The extreme value distribution is a
distribution of maxima. It is the least utilized of the four life
distributions.
–5
For means of example, the Weibull distribution will be used.
The Weibull lifetime distribution has the form:
which is equal to 8.6171x10 eV/K. The relative humidity is
entered as a whole number, i.e. 85 for 85%. Using this sample
model, test results from humidity testing can be related to the
lifetime. The methods to equate test time to lifetime first
involves fitting the failure data to a lifetime distribution. For an
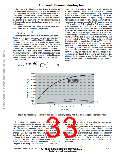
example, humidity data at 60°C, 90% relative humidity and
bias was tested to failure. The failure data fit a Weibull
distribution with a characteristic life of 40,000 hours. By
applying the acceleration factor equation shown above,
quantification of the lifetime in the use conditions can be
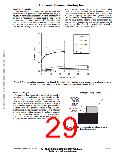
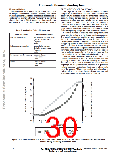
calculated. Figure 15 shows the cumulative failure distribution
for the test and use conditions for a 15 year lifetime. This
technique is key for media testing since the range of use
conditions is very broad. The consumer can determine the
attributes for the sensor to use for the application. The
attributes might include cost, performance, and possibility for
replacement.
t
F(t, θ, β)
1
e
.
(1)
The two parameters for the Weibull distribution are q and b.
Theta is the scale parameter, or characteristic life. It
represents the 63.2 percentile of the life distribution. Beta is
the shape parameter. In order to determine the parameters for
the Weibull distribution, testing must be performed produce
failure on the devices. The failure data can be used to
calculate the maximum likelihood estimates or determined
graphically. It has not always been customary to perform
reliability demonstration testing until failures occur. In regards
to media testing, this seems to be the only method to derive
lifetime estimates that reflect a true understanding of the
device capability.
n
Ea
k
1
1
RHhigh
RHlow
T
T
low
high
(2)
AF
e
,
•
100%
90%
80%
70%
60%
50%
40%
30%
20%
10%
0%
Test Condition
(60 C, 90% RH)
(30 C, 85% RH)
(25 C, 60% RH)
0
1
2
3
4
5
6
7
8
9
10
11
12 13 14
15
TIME (YEARS)
Figure 15. Probability of failure versus time for humidity testing with bias on an integrated sensor device.
The failure distribution example shown typically
representsonefailuremechanism. Thefailuremechanism
that typifies humidity testing is mobile ions. An elevated
test temperature, humidity and bias contributes to the
mobility of the ions and the ability to create a surface
charge. By lowering the temperature, humidity or
switching the bias, an improvement in the lifetime can be
obtained. If a device manufacturer would test to failure and
report the lifetimes, the customer could select the
appropriate product for their application. Following a
template of reliability tests that have not been verified and
do not coincide with the applicable failure mechanism may
put the application at risk for surviving.
Humidity testing was used as an example above, but a
similar case could be made of other attributes involved
with media testing. Other attributes of the media test may
include the bias level and duty cycle, the pH or conductivity
of the solution, and any stress such as a pressure
differential. By modeling these attributes against the
various solutions, models for media compatibility can be
developed.
Motorola Sensor Device Data
www.motorola.com/semiconductors
1–27
For More Information On This Product,
Go to: www.freescale.com

 MOTOROLA [ MOTOROLA ]