Freescale Semiconductor, Inc.
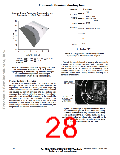
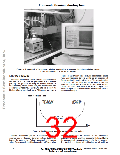
Figure 13. Photograph of the aqueous alkaline solution test system and the data acquisition system
for in situ monitoring of the MEMS devices.
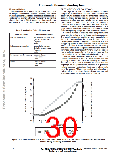
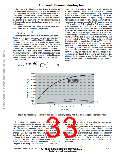
Figure 14, has an early life period with a decreasing failure
rate. Manufacturing defects would be an example of
failures duringthisportionofthecurve. Thesecondportion
of the curve, often described as the useful life region has
a constant failure rate. The last section has an increasing
failure rate and is referred to as the wearout region. This
wearout region would include failure mechanisms such as
corrosion or fatigue.
LIFETIME MODELING
Reliability techniquesprovideameans to analyzemedia
test results and equate the performance to a lifetime
[23–24]. The primary reliability techniques involve an
understanding of the failure rate, life distributions, and
acceleration modeling. The failure rate for a product’s
lifetime follows the bathtub curve. This curve, as shown in
Product Failure Rate
INFANT MORTALITY
OR EARLY LIFE
FAILURE RATE
END OF LIFE
OR WEAR OUT
FAILURE RATE
STEADY STATE
FAILURE RATE
Time
Figure 14. Bathtub curve showing various failure rate regions.
Lifetime distributions provide a theoretical model to
describe device lifetimes. Common lifetime distributions
include the exponential, Weibull, lognormal, and extreme
value. The exponential distribution models a lifetime with a
constant failure rate An example of the exponential
distribution is a glass which has an equal probability of failing
the moment after it is manufactured, or when its ten years old.
The Weibull and lognormal distribution are all right, or
1–26
www.motorola.com/semiconductors
Motorola Sensor Device Data
For More Information On This Product,
Go to: www.freescale.com

 MOTOROLA [ MOTOROLA ]