Freescale Semiconductor, Inc.
frequencies of an event to established confidence intervals.
The relationship between failure rate and the chi-square
distribution is as follows:
new product and they have put a total of 1,000 parts on a
high temperature storage test for 500 hours each, their
corresponding cumulative device hours would be 500,000
device hours. Vendor B has been in the business for several
years on the same product and has tested a total of 500,000
parts for 10 hours each to the same conditions as part of an
in-line burn-in test for a total of 5,000,000 device hours. The
corresponding failure rate for a 60% confidence level for
vendor A would be 1,833 FITs, vendor B would have a FIT
rate of 183 FITs.
2
, d.f.
L1
2t
Where:
λ
=
=
=
=
=
=
=
failure rate
L1
2
lower one side confidence limit
chi–square function
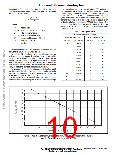
Table 1. Chi-Square Table
χ
Chi-Square Distribution Function
α
risk, (1–confidence level)
degrees of freedom = 2 (r + 1)
number of failures
60% Confidence Level
2
90% Confidence Level
d.f.
2
r
t
No. Fails
χ
Quantity
1.833
No. Fails
χ
Quantity
4.605
device hours
0
1
0
1
4.045
7.779
2
6.211
2
10.645
13.362
15.987
18.549
21.064
23.542
25.989
28.412
30.813
33.196
35.563
Chi-square values for 60% and 90% confidence intervals
for up to 12 failures is shown in Table 1.
3
8.351
3
As indicated by the table, when no failures occur, an
estimate for the chi-square distribution interval is obtainable.
This interval estimate can then be used to solve for the
failure rate, as shown in the equation above. If no failures
occur, the failure rate estimate is solely a function of the
accumulated device hours. This estimate can vary dramati-
cally as additional device hours are accumulated.
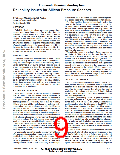
As a means of showing the influence of device hours with
no failures on the failure rate value, a graphical representa-
tion of cumulative device hours versus the failure rate
measured in FITs is shown in Figure 1.
4
10.473
12.584
14.685
16.780
18.868
20.951
23.031
25.106
27.179
4
5
5
6
6
7
7
8
8
9
9
10
11
12
10
11
12
A descriptive example between two potential vendors best
serves to demonstrate the point. If vendor A is introducing a
9
10
8
10
7
10
6
10
5
10
4
10
1,000
100
10
1
0.1
4
10
5
10
6
10
7
10
8
10
9
10
1
10
100
1,000
CUMULATIVE DEVICE HOURS, [t]
Figure 1. Depiction of the influence on the cumulative device hours with no failures
and the Failure Rate as measured in FITs.
1–4
www.motorola.com/semiconductors
Motorola Sensor Device Data
For More Information On This Product,
Go to: www.freescale.com

 MOTOROLA [ MOTOROLA ]