Quasi-Resonant, 800V CoolSET™ in DS0-12 Package
Input Power Curve
6
Input Power Curve
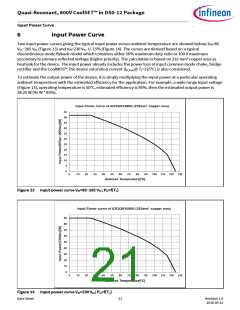
Two input power curves giving the typical input power versus ambient temperature are showed below; VIN=85
VAC~265 VAC (Figure 13) and VIN=230 VAC +/-15% (Figure 14). The curves are derived based on a typical
discontinuous mode flyback model which considers either 50% maximum duty ratio or 100 V maximum
secondary to primary reflected voltage (higher priority). The calculation is based on 232 mm2 copper area as
heatsink for the device. The input power already includes the power loss at input common mode choke, bridge
rectifier and the CoolMOS™.The device saturation current (ID_Puls @ Tj=125°C) is also considered.
To estimate the output power of the device, it is simply multiplying the input power at a particular operating
ambient temperature with the estimated efficiency for the application. For example, a wide range input voltage
(Figure 13), operating temperature is 50°C, estimated efficiency is 85%, then the estimated output power is
38.25 W (45 W * 85%).
Figure 13 Input power curve VIN=85~265 VAC; Pin=f(Ta)
Figure 14 Input power curve VIN=230 VAC; Pin=f(Ta)
Data Sheet
21
Revision 1.0
2016-05-12

 INFINEON [ Infineon ]