CDB5510/11/12/13
graph to select one corner of the desired Zoom area.
oped at Cirrus Logic. If information concerning
When prompted, click on the graph again to select these algorithms is needed, call technical support.
the opposite corner of the desired zoom area. Once
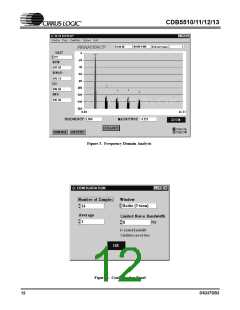
AVERAGE: Sets the number of consecutive FFT’s
an area has been zoomed to, the printing functions
to perform and average.
can be used to print a hard copy of that region. Click
LIMITED NOISE BANDWIDTH: Limits the
amount of noise in the converters bandwidth. De-
fault is 0 Hz.
on RESTORE when done with the zoom function to
display the entire data set graph. A region can also be
magnified further by clicking on the ZOOM button
again.
OK: Accept the changes and close the window
RESTORE: Restores the display of the graph after
zoom has been entered. No matter how far in the
user has magnified the data plot, the RESTORE
button will return to the fully zoomed-out data plot.
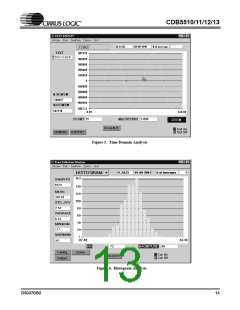
2.3.1 Histogram Plots
The following is a description of the indicators asso-
ciated with Histogram analysis (Figure 6).
BIN: Displays the x-axis value of the cursor on the
Histogram. This represents the output code from the
part.
TIME DOMAIN / FFT / HISTOGRAM Selector:
This pull-down menu selects between time domain,
frequency domain, and histogram mode to perform
and display the appropriate analysis of the data set.
MAGNITUDE: Displays the y-axis value of the
cursor on the Histogram. This represents the num-
ber of times a certain output code occurred in the
collected data set.
Cal On/Cal Off: This switch allows the user to ap-
ply the calibration values to the data set as it is col-
lected. When the switch is in the Off position, the
collected results will reflect the raw conversion
data from the ADC. When the switch is in the On
position, the calibration values from the Setup
Window will be applied to the data as it is collect-
ed. This switch must be set to the desired value be-
fore data is collected, since the calibration values
can only be applied during the collection process.
MAXIMUM: Indicator for the maximum value of
the collected data set.
MEAN: Indicator for the mean (average) of the data
sample set.
MINIMUM: Indicator for the minimum value of
the collected data set.
STD. DEV.: Indicator for the Standard Deviation
of the collected data set.
CONFIG: Opens a pop-up panel (Figure 4) to con-
figure how much data is to be collected, and how to
process the data once it is collected. The following
are controls and indicators associated with the
CONFIG panel.
VARIANCE: Indicates the Variance for the cur-
rent data set.
2.3.2 Frequency Domain (FFT) Plots
SAMPLES: Allows the user to select the number of
conversions to collect, between 16 and 32,768.
The following describe the indicators associated
with Frequency Domain (FFT) analysis (Figure 3).
WINDOW: Used in the Power Spectrum Window
to calculate the FFT. Windowing algorithms in-
clude the Blackman, Blackman-Harris, Hanning,
5-term Hodie, and 7-term Hodie. The 5-term Hodie
and 7-term Hodie are windowing algorithms devel-
FREQUENCY: Displays the x-axis value of the
cursor on the FFT display. This represents the cen-
ter frequency of the currently selected bin in Hz.
MAGNITUDE: Displays the y-axis value of the
cursor on the FFT display. This represents the total
power in dB contained in the selected bin.
DS337DB2
9

 CIRRUS [ CIRRUS LOGIC ]