CDB5510/11/12/13
S/D: Indicator for the Signal-to-Distortion Ratio, in
dB. This is the ratio of the signal magnitude to the
magnitude of the first four harmonics.
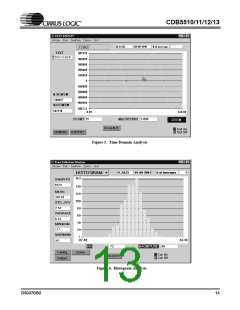
2.3.3 Time Domain Plots
The following indicators are associated with Time
Domain analysis (Figure 5).
S/N+D: Indicator for the Signal-to-Noise + Distor-
tion Ratio in dB. This is the ratio of the signal mag-
nitude to the magnitude of the first four harmonics
and the noise.
COUNT: Displays current x-position of the cursor
on the time domain display. This represents the po-
sition of the code within the collected sample set.
MAGNITUDE: Displays current y-position of the
cursor on the time domain display. This represents
the actual code from the converter.
SNR: Indicator for the Signal-to-Noise Ratio in
dB. This is the ratio of the signal magnitude to the
magnitude of the noise (an average noise value is
included in place of the first four harmonics).
MAXIMUM: Indicator for the maximum value of
the collected data set.
S/PN: Indicator for the Signal-to-Peak Noise Ratio
in dB. This is the ratio of the signal magnitude to
the magnitude of the highest noise component not
included in the harmonics of the signal.
MINIMUM: Indicator for the minimum value of
the collected data set.
# of AVG: Displays the number of FFT’s averaged
in the current display.
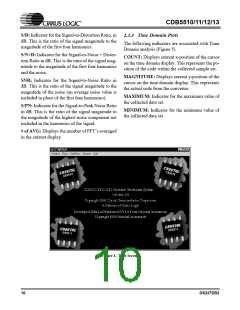
Figure 1. Title Screen
10
DS337DB2

 CIRRUS [ CIRRUS LOGIC ]