Preliminary Datasheet
BOOST CONTROLLER
AP3039
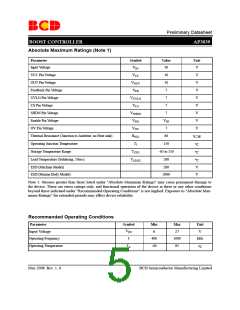
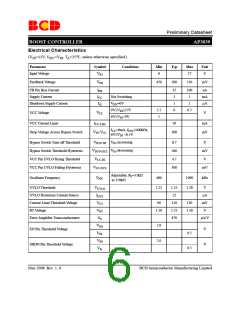
Typical Performance Characteristics (Continued)
2.0
1.8
1.6
1.4
1.2
1.0
0.8
0.6
0.4
0.2
0.0
6.5
6.4
6.3
6.2
6.1
6.0
5.9
5.8
5.7
5.6
5.5
-50OC
25OC
85OC
125OC
-50OC
25OC
85OC
125OC
6
9
12
15
18
21
24
27
6
9
12
15
18
21
24
27
Input Voltage (V)
Input Voltage
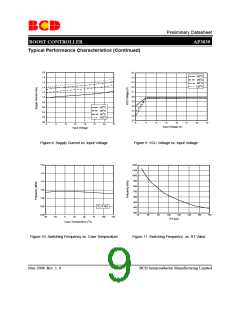
Figure 8. Supply Current vs. Input Voltage
Figure 9. VCC Voltage vs. Input Voltage
1.20
1.15
1.10
1.05
1.00
1200
1100
1000
900
800
700
600
500
400
300
0.95
RT=51kΩ
0.90
-50
40
60
80
100
120
140
160
180
-25
0
25
50
75
100
125
RT (kΩ)
Case Temperature (OC)
Figure 10. Switching Frequency vs. Case Temperature
Figure 11. Switching Frequency vs. RT Value
May 2008 Rev. 1. 0
BCD Semiconductor Manufacturing Limited
9

 BCDSEMI [ BCD SEMICONDUCTOR MANUFACTURING LIMITED ]