AT90USB82/162
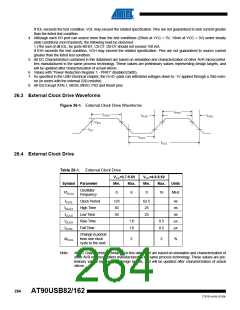
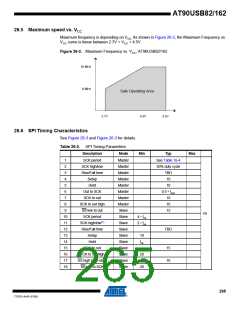
26.5 Maximum speed vs. VCC
Maximum frequency is depending on VCC. As shown in Figure 26-2, the Maximum Frequency vs.
CC curve is linear between 2.7V < VCC < 4.5V.
V
Figure 26-2. Maximum Frequency vs. VCC, AT90USB82/162
16 MHz
8 MHz
Safe Operating Area
2.7V
4.5V
5.5V
26.6 SPI Timing Characteristics
See Figure 26-3 and Figure 26-3 for details.
Table 26-2. SPI Timing Parameters
Description
SCK period
SCK high/low
Rise/Fall time
Setup
Mode
Master
Master
Master
Master
Master
Master
Master
Master
Slave
Min
Typ
Max
1
2
See Table 16-4
50% duty cycle
3
TBD
10
4
5
Hold
10
6
Out to SCK
SCK to out
SCK to out high
SS low to out
SCK period
SCK high/low(1)
Rise/Fall time
Setup
0.5 • tsck
10
7
8
10
9
15
ns
10
11
12
13
14
15
16
17
18
Slave
4 • tck
2 • tck
Slave
Slave
TBD
Slave
10
tck
Hold
Slave
SCK to out
SCK to SS high
SS high to tri-state
SS low to SCK
Slave
15
10
Slave
20
20
Slave
Slave
265
7707D–AVR–07/08

 ATMEL [ ATMEL ]