Wire Supplying
Vbias from
Agilent 4142
Blocking
Cap
RF
Input
62x
Direct to
Ground
Direct to
Ground
Bias
RF Output
Bias
Tee
Vdd supply from
Agilent 4142
Reference
Planes
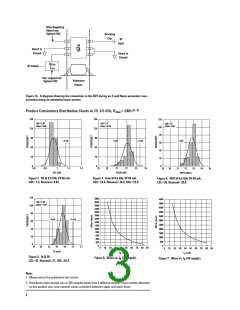
Figure 1b. A diagram showing the connection to the DUT during an S and Noise parameter mea-
surement using an automated tuner system.
Product Consistency Distribution Charts at 3V, 0.5 GHz, Rbias = 240Ω[1, 2]
150
120
90
60
30
0
150
120
90
60
30
0
120
100
80
60
40
20
0
cpk=2.45
stdev=0.06
cpk=1.3
stdev=0.36
cpk=1.9
stdev=0.51
+3 std
-3 std
+3 std
-3 std
0.6
0.8
1
1.2
1.4
19
20
21
22
23
24
29
30
31
32
OIP3 (dBm)
33
34
35
NF (dB)
GAIN (dB)
Figure 2. NF @ 0.5 GHz 3V 60 mA.
USL=1.4, Nominal=0.93.
Figure 3. Gain @ 0.5 GHz 3V 60 mA.
USL=23.4, Nominal=20.4, USL=22.0.
Figure 4. OIP3 @ 0.5 GHz 3V 60 mA.
LSL=30, Nominal=32.9.
120
2800
2600
2400
2200
2000
1800
1600
1400
1200
1000
800
5500
5000
4500
4000
3500
3000
2500
2000
1500
1000
500
cpk=2.39
stdev=2.09
100
80
-3 std
+3 std
60
40
20
0
600
400
200
0
0
47
52
57
62
Id (mA)
67
72
77
0
10 20 30 40 50 60 70 80 90
(mA)
0
10 20 30 40 50 60 70 80 90
(mA)
I
I
d
d
Figure 5. Id @ 3V.
LSL=47, Nominal=77, USL=62.0.
Figure 6. Rbias vs. I (3V supply).
Figure 7. Rbias vs. I (5V supply).
d
d
Note:
1. Measured on the production test circuit
2. Distribution data sample size is 250 samples taken from 5 different wafers. Future wafers allocated
to this product may have nominal values anywhere between upper and lower limits
3

 AGILENT [ AGILENT TECHNOLOGIES, LTD. ]