ADSP-BF542/ADSP-BF544/ADSP-BF547/ADSP-BF548/ADSP-BF549
THERMAL CHARACTERISTICS
To determine the junction temperature on the application
printed circuit board use
132
128
T
= T
+ (Ψ × P )
JT
124
120
116
J
CASE
D
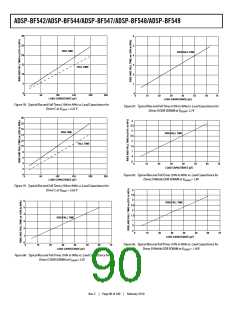
FALL TIME
where:
TJ =junction temperature (ꢄC)
CASE = case temperature (ꢄC) measured by customer at top cen-
T
ter of package.
112
108
ΨJT = from Table 71
PD = power dissipation. (See Table 18 on Page 38 for a method
to calculate PD.)
0
50
100
150
200
250
LOAD CAPACITANCE (pF)
Values of θJA are provided for package comparison and printed
circuit board design considerations. θJA can be used for a first
order approximation of TJ by the equation
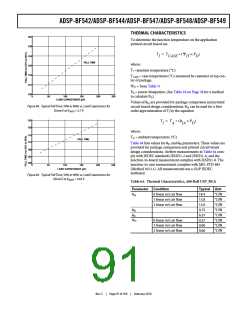
Figure 84. Typical Fall Time (10% to 90%) vs. Load Capacitance for
Driver E at VDDEXT = 2.7 V
124
120
T
= T + (θ × P )
JA
J
A
D
where:
TA = ambient temperature (ꢄC)
116
FALL TIME
112
Table 64 lists values for θJC and θJB parameters. These values are
provided for package comparison and printed circuit board
design considerations. Airflow measurements in Table 64 com-
ply with JEDEC standards JESD51-2 and JESD51-6, and the
junction-to-board measurement complies with JESD51-8. The
junction-to-case measurement complies with MIL-STD-883
(Method 1012.1). All measurements use a 2S2P JEDEC
testboard.
108
104
100
0
50
100
150
200
250
LOAD CAPACITANCE (pF)
Figure 85. Typical Fall Time (10% to 90%) vs. Load Capacitance for
Driver E at VDDEXT = 3.65 V
Table 64. Thermal Characteristics, 400-Ball CSP_BGA
Parameter Condition
Typical Unit
θJA
0 linear m/s air flow
18.4
15.8
15.0
9.75
6.37
0.27
0.60
0.66
ꢄC/W
ꢄC/W
ꢄC/W
ꢄC/W
ꢄC/W
ꢄC/W
ꢄC/W
ꢄC/W
1 linear m/s air flow
2 linear m/s air flow
θJB
θJC
ΨJT
0 linear m/s air flow
1 linear m/s air flow
2 linear m/s air flow
Rev. C
|
Page 91 of 100
|
February 2010

 ADI [ ADI ]