PRELIMINARY
PCT1789W DATA SHEET
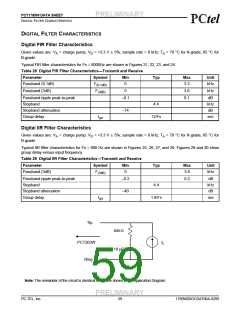
DIGITAL FILTER CHARACTERISTICS
!!
Figure 20 Test Circuit For Loop Characteristics
Filter Plot Diagrams
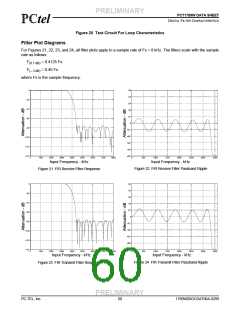
For Figures 21, 22, 23, and 24, all filter plots apply to a sample rate of Fs = 8 kHz. The filters scale with the sample
rate as follows:
F(0.1 dB) = 0.4125 Fs
F(– 3 dB) = 0.45 Fs
where Fs is the sample frequency.
Input Frequency - kHz
Input Frequency - kHz
Figure 22 FIR Receive Filter Passband Ripple
Figure 21 FIR Receive Filter Response
Input Frequency - kHz
Input Frequency - kHz
Figure 24 FIR Transmit Filter Passband Ripple
Figure 23 FIR Transmit Filter Response
PRELIMINARY
PC-TEL, Inc.
60
1789W0DOCDAT06A-0299

 ETC [ ETC ]