TPA005D02
2-W STEREO CLASS-D AUDIO POWER AMPLIFIER
SLOS227C – AUGUST 1998 – REVISED MARCH 2000
APPLICATION INFORMATION
class D effect on power supply (continued)
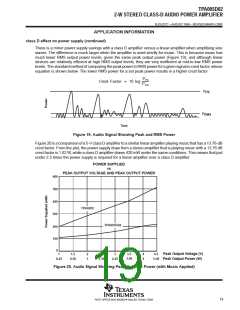
There is a minor power supply savings with a class D amplifier versus a linear amplifier when amplifying sine
waves. The difference is much larger when the amplifier is used strictly for music. This is because music has
much lower RMS output power levels, given the same peak output power (Figure 19); and although linear
devices are relatively efficient at high RMS output levels, they are very inefficient at mid-to-low RMS power
levels. The standard method of comparing the peak power to RMS power for a given signal is crest factor, whose
equation is shown below. The lower RMS power for a set peak power results in a higher crest factor
PPK
Prms
Crest Factor
10 log
P
PK
P
RMS
Time
Figure 19. Audio Signal Showing Peak and RMS Power
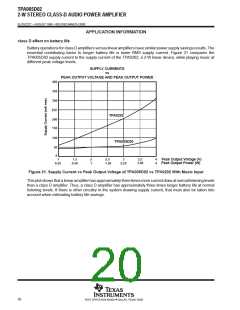
Figure20isacomparisonofa5-VclassDamplifiertoasimilarlinearamplifierplayingmusicthathasa13.76-dB
crest factor. From the plot, the power supply draw from a stereo amplifier that is playing music with a 13.76 dB
crest factor is 1.02 W, while a class D amplifier draws 420 mW under the same conditions. This means that just
under 2.5 times the power supply is required for a linear amplifier over a class D amplifier.
POWER SUPPLIED
vs
PEAK OUTPUT VOLTAGE AND PEAK OUTPUT POWER
600
500
400
TPA0202
300
TPA005D02
200
100
0
3.5
Peak Output Voltage (V)
Peak Output Power (W)
1
1.5
2
1
2.5
3
4
4
4.5
3.06
0.25
0.56
1.56
2.25
5.06
Figure 20. Audio Signal Showing Peak and RMS Power (with Music Applied)
19
POST OFFICE BOX 655303 • DALLAS, TEXAS 75265

 TI [ TEXAS INSTRUMENTS ]