TDA7850
Electrical specifications
3.4
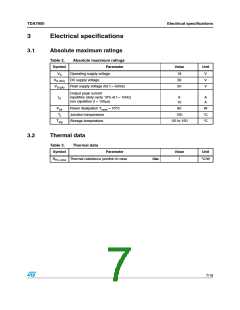
Electrical characteristic curves
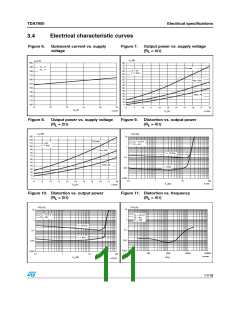
Figure 6.
Quiescent current vs. supply
voltage
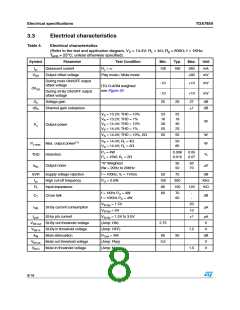
Figure 7.
Output power vs. supply voltage
(R = 4Ω)
L
Po (W)
I
(mA)
V
d
80
75
70
65
60
55
50
45
40
35
30
25
20
15
10
5
200
190
180
170
160
150
140
130
120
110
100
= 0
i
Po-max
R
=
∞
L
RL= 4Ω
f = 1 KHz
THD= 10%
THD= 1%
8
10
12
14
16
18
8
9
10
11
12
13
14
15
16
17
18
V
(V)
s
AC00064
AC00064
Vs (V)
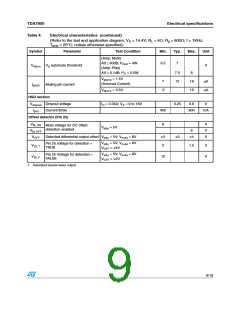
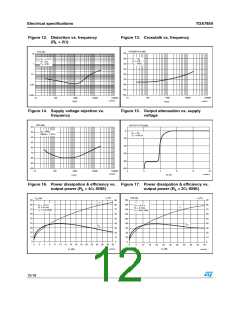
Figure 8.
Output power vs. supply voltage
(R = 2Ω)
Figure 9.
Distortion vs. output power
(R = 4Ω)
L
L
P
(W)
THD (%)
10
o
130
120
110
100
90
Po-max
VS = 14.4 V
L = 4Ω
RL= 2Ω
f = 1 KHz
R
1
0.1
THD=10%
80
f = 10 KHz
70
60
50
THD=1%
40
f = 1 KHz
0.01
30
20
10
0.001
0
0.1
1
10
100
8
9
10
11
12
13
(V)
14
15
16
17
18
AC00067
Po (W)
V
AC00066
s
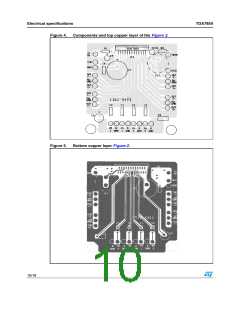
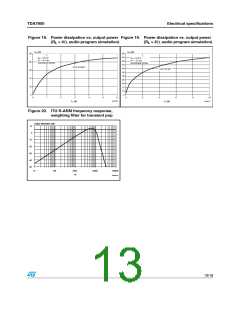
Figure 10. Distortion vs. output power
Figure 11. Distortion vs. frequency
(R = 2Ω)
(R = 4Ω)
L
L
THD (%)
THD (%)
10
1
10
1
VS = 14.4 V
= 2Ω
VS = 14.4 V
L = 4Ω
o = 4 W
R
R
L
P
f = 10 KHz
f = 1 KHz
0.1
0.1
0.01
0.001
0.01
0.001
10
100
1000
f (Hz)
10000
100000
0.1
1
10
100
AC00069
P
(W)
o
AC00068
11/18

 STMICROELECTRONICS [ ST ]