DS2781
Active Empty: The Active Empty curve defines the temperature variation in the empty point of the discharge profile
based on a high level load current (one that is sustained during a high power operating mode) and the minimum
voltage required for system operation. This load current is programmed as the Active Empty current (IAE), and
should be a 3.5s average value to correspond to values read from the Current register, and the specified minimum
voltage, or Active Empty voltage (VAE) should be a 250ms average to correspond to values read from the Voltage
register. The DS2781 reconstructs the Active Empty line from cell characteristic table values to determine the
Active Empty capacity of the battery at each temperature. Reconstruction occurs in one-degree temperature
increments. Active Empty segment slopes are stored the same as described for the Full segments above.
Standby Empty: The Standby Empty curve defines the temperature variation in the empty point in the discharge
defined by the application standby current and the minimum voltage required for standby operation. Standby Empty
represents the point that the battery can no longer support a subset of the full application operation, such as
memory data retention or organizer functions on a wireless handset. Standby Empty segment slopes are stored the
same as described for the Full segments above.
The standby load current and voltage are used for determining the cell characteristics but are not programmed into
the DS2781. The DS2781 reconstructs the Standby Empty line from cell characteristic table values to determine
the Standby Empty capacity of the battery at each temperature. Reconstruction occurs in one-degree temperature
increments.
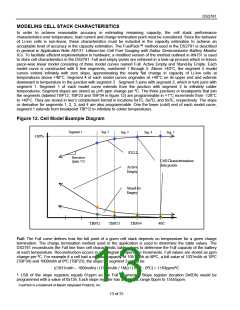
CELL STACK MODEL CONSTRUCTION
The model is constructed with all points normalized to the fully charged state at +40°C. Initial values, the +40°C
Full value in mVh units and the +40°C Active Empty value as a fraction of the +40°C Full are stored in the cell
parameter EEPROM block. Standby Empty at +40°C is by definition zero and therefore no storage is required. The
slopes (derivatives) of the 4 segments for each model curve are also stored in the cell parameter EEPROM block
along with the break point temperatures of each segment. An example of data stored in this manner is shown in
Table 1.
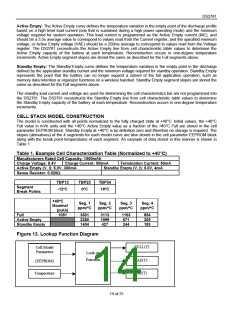
Table 1. Example Cell Characterization Table (Normalized to +40°C)
Manufacturers Rated Cell Capacity: 1000mAh
Charge Voltage: 8.4V
Charge Current: 500mA
Termination Current: 50mA
Active Empty (V, I): 6.0V, 300mA
Standby Empty (V, I): 6.0V, 4mA
Sense Resistor: 0.020Ω
TBP12
TBP23
0ºC
TBP34
Segment
Break Points
-12ºC
18ºC
+40°C
Nominal
[mAh]
Seg. 1
ppm/°C
Seg. 2
ppm/°C
Seg. 3
ppm/°C
Seg. 4
ppm/°C
Full
1051
3601
2380
1404
3113
1099
427
1163
671
244
854
305
183
Active Empty
Standby Empty
Figure 13. Lookup Function Diagram
FULL(T)
Cell Model
Parameters
Look-up
Function
AE(T)
SE(T)
(EEPROM)
Temperature
14 of 31

 MAXIM [ MAXIM INTEGRATED PRODUCTS ]