DS2781
MODELING CELL STACK CHARACTERISTICS
In order to achieve reasonable accuracy in estimating remaining capacity, the cell stack performance
characteristics over temperature, load current and charge termination point must be considered. Since the behavior
of Li-ion cells is non-linear, these characteristics must be included in the capacity estimation to achieve an
acceptable level of accuracy in the capacity estimation. The FuelPack™ method used in the DS2781 is described
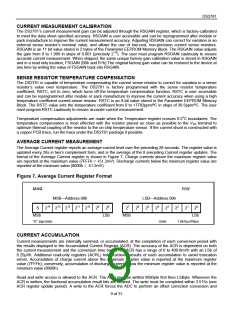
in general in Application Note AN131: Lithium-Ion Cell Fuel Gauging with Dallas Semiconductor Battery Monitor
ICs. To facilitate efficient implementation in hardware, a modified version of the method outlined in AN131 is used
to store cell characteristics in the DS2781. Full and empty points are retrieved in a look-up process which re-traces
piece-wise linear model consisting of three model curves named Full, Active Empty and Stand-by Empty. Each
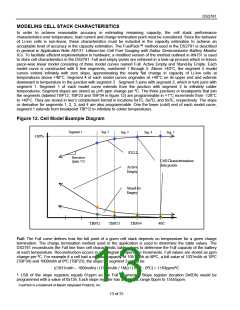
model curve is constructed with 5 line segments, numbered 1 through 5. Above +40°C, the segment 5 model
curves extend infinitely with zero slope, approximating the nearly flat change in capacity of Li-Ion cells at
temperatures above +40°C. Segment 4 of each model curves originates at +40°C on its upper end and extends
downward in temperature to the junction with segment 3. Segment 3 joins with segment 2, which in turn joins with
segment 1. Segment 1 of each model curve extends from the junction with segment 2 to infinitely colder
temperatures. Segment slopes are stored as µVh ppm change per ºC. The three junctions or breakpoints that join
the segments (labeled TBP12, TBP23 and TBP34 in figure 12) are programmable in +1°C increments from -128°C
to +40°C. They are stored in two’s complement format in locations 0x7C, 0x7D, and 0x7E, respectively. The slope
or derivative for segments 1, 2, 3, and 4 are also programmable. One the lower (cold) end of each model curve,
segment 1 extends from breakpoint TBP12 to infinitely to colder temperatures.
Figure 12. Cell Model Example Diagram
Segment 1
Seg. 2
Seg. 3
Seg. 4
Seg. 5
100%
FULL
Derivative
[ppm / C]
Cell Characterization
data points
Active
Empty
Stand-by
Empty
TBP12
TBP23
TBP34
40C
Full: The Full curve defines how the full point of a given cell stack depends on temperature for a given charge
termination. The charge termination method used in the application is used to determine the table values. The
DS2781 reconstructs the Full line from cell characteristic table values to determine the Full capacity of the battery
at each temperature. Reconstruction occurs in one-degree temperature increments. Full values are stored as ppm
change per ºC. For example if a cell had a nominal capacity of 1051mAh at 40ºC, a full value of 1031mAh at 18ºC
(TBP34) and 1009mAh at 0ºC (TBP23), the slope for segment 3 would be:
((1031mAh – 1009mAh) / (1051mAh / 1M)) / (18ºC - 0ºC) = 1163ppm/ºC
1 LSB of the slope registers equals 61ppm so the Full Segment 3 Slope register (location 0x6Dh) would be
programmed with a value of 0x13h. Each slope register has a dynamic range 0ppm to 15555ppm.
FuelPack is a trademark of Maxim Integrated Products, Inc.
13 of 31

 MAXIM [ MAXIM INTEGRATED PRODUCTS ]