HRF-SW1000
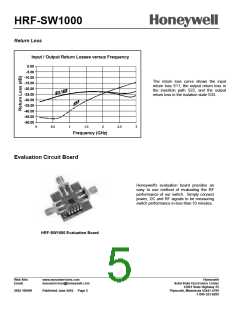
Performance Curves
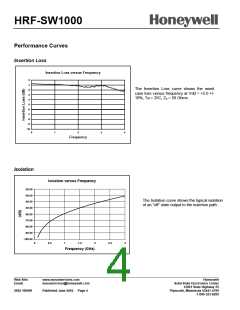
Insertion Loss
Insertion Loss versus Frequency
0
-1
The Insertion Loss curve shows the worst
case loss versus frequency at Vdd = +5.0 +/-
10%, Ta = 25C, Z0 = 50 Ohms
-2
-3
-4
-5
-6
-7
-8
-9
-10
0
1
2
3
4
Frequency
Isolation
Isolation versus Frequency
-20.00
-30.00
-40.00
-50.00
-60.00
-70.00
-80.00
-90.00
-100.00
The Isolation curve shows the typical isolation
of an “off” state output to the insertion path.
0
0.5
1
1.5
2
2.5
3
Frequency (GHz)
________________________________________________________________________________________________________
Web Site:
Email:
www.mysoiservices.com
mysoiservices@honeywell.com
Honeywell
Solid State Electronics Center
12001 State Highway 55
2002 1000W
Published June 2002 Page 4
Plymouth, Minnesota 55441-4799
1-800-323-8295

 HONEYWELL [ Honeywell ]