TM
Technical Specification
S25-48-3.3, S25-48-3.3N
48Vin 3.3Vout 7A
Characterization
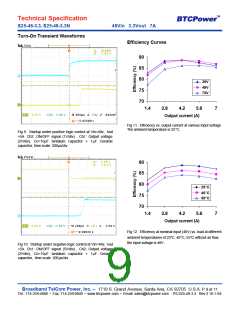
Efficiency with nominal input (48V) at different
ambient temperatures (25°C, 40°C and 55°C) is
also given in Fig 12.
General information
This unit has many operational characterized
aspects including thermal derating, efficiency,
start up and overshoot, output ripple & noise,
dynamic response, over current protection curve
and etc.
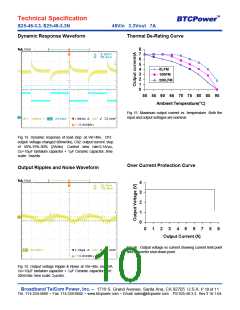
Dynamic Response
The dynamic response of the unit at load step is
shown in Fig 13. The output load current change
from 50% to 75% and return to 50% at the slew
of 0.1A/ms. The input is 48V and a filter of 10mF
tantalum capacitor plus a 1mF ceramic capacitor
The following pages contain specific plots or
waveforms associated with the unit. Additional
comments for specific data are provided below.
is put parallel to the output.
Ripple and Noise
Test Conditions
The output voltage waveform has been measured
at full load condition, with 10mF tantalum
capacitor plus 1mF Ceramic capacitor closely
parallel to the unit’s output. Fig 14 shows the
output ripple and noise waveform.
All data presented were taken with the unit
soldered to a test board, which is a 0.060” thick
printed circuit board. No heat sink was used
during all measurements. No airflow was used
except in the de-rating test.
Thermal De-rating
For the input line, a 1mF /100V ceramic capacitor
has been used during all these tests. On the
output side, a 10mF tantalum capacitor with Esr <
0.12W and 1mF ceramic capacitor has been used.
The capacitors on both the input and output sides
were close to the unit.
For thermal de-rating test, the output current vs.
the ambient temperature and the airflow rates
has been measured, and the results are given in
Fig 15.
The ambient temperature varies between 50°C
and 85°C with the airflow of 0, 100 and 200LFM
(0, 0.5m/s and 1m/s).
NOTE:
It is important to make sure that the components
on the unit do not exceed their rating.
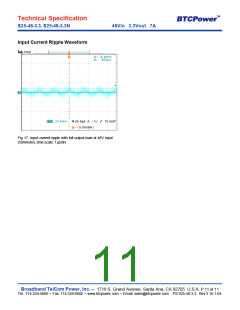
Others
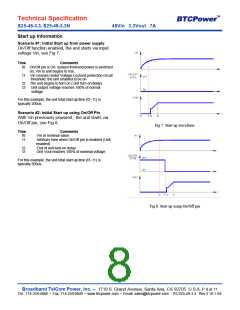
Start up
Other curve and waveforms presented include
the output voltage vs. current curve (Fig 16) and
the input current ripple waveform at full load
condition (Fig 17)
The startup scenarios are explained in Fig 7 and
8.
The measured waveforms showing the turn on
transient are given in Fig 9 and 10, for both
positive and negative logic control units.
Efficiency
Efficiency vs. load current curve at different
inputs of 36V, 48V and 75V is given in Fig 11.
The ambient temperature is 25°C.
Broadband TelCom Power, Inc. – 1719 S. Grand Avenue, Santa Ana, CA 92705 U.S.A. P 7 of 11
Tel.: 714-259-4888 • Fax: 714-259-0840 • www.btcpower.com • Email: sales@btcpower.com PS S25-48-3.3 Rev 3 16-1-04

 BTCPOWER [ BROADBAND TELCOM POWER, INC. ]