MEASUREMENT TEMPERATURE SPAN ∆T (°C)
300°C 400°C 500°C 600°C 700°C
–200°C 18.7/86.6 18.7/169 18.7/255 18.7/340 18.7/422 18.7/511 18.7/590 18.7/66.5 18.7/750 18.7/845
TMIN
100°C
200°C
800°C
900°C
1000°C
15000
16500
9760
11500
8060
10000
6650
8870
5620
7870
4750
7150
4020
6420
3480
5900
3090
5360
2740
4990
–100°C 60.4/80.6 60.4/162 60.4/243 60.4/324 60.4/402 60.4/487 60.4/562 60.4/649 60.4/732
27400
29400
15400
17800
10500
13000
7870
10200
6040
8660
4990
7500
4220
6490
3570
5900
3090
5360
0°C
100/78.7 100/158
100/237
10500
13000
100/316
7680
10000
100/392
6040
8250
100/475
4870
7150
100/549
4020
6340
100/634
3480
5620
33200
35700
16200
18700
100°C
200°C
300°C
400°C
500°C
600°C
700°C
800°C
137/75
31600
34000
137/150
15400
17800
137/226
10200
12400
137/301
7500
9760
137/383
5760
8060
137/453
4750
6810
137/536
3920
6040
RZ /RG
RLIN1
RLIN2
174/73.2 174/147
30900
3320
174/221
9760
12100
174/294
7150
9310
174/365
5620
7680
174/442
4530
6490
15000
17400
210/71.5 210/143
30100
32400
210/215
9530
11500
210/287
6980
8870
210/357
5360
7320
14700
16500
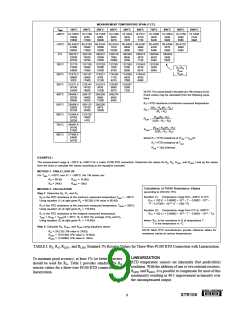
NOTE: The values listed in the table are 1% resistors (in Ω).
Exact values may be calculated from the following equa-
tions:
249/68.1 249/137
28700
30900
249/205
9090
11000
249/274
6650
8450
14000
16200
RZ = RTD resistance at minimum measured temperature.
280/66.5 280/133
28000
30100
280/200
8870
10500
13700
15400
2(R2 – RZ )(R1 – RZ )
RG
=
(R2 – R1)
316/64.9 313/130
26700
28700
RLIN(R2 – R1)
13000
1470
RLIN1
=
2(2R1 – R2 – RZ )
348/61.9
26100
27400
(RLIN +RG)(R2 – R1)
RLIN2
=
2(2R1 – R2 – RZ )
374/60.4
24900
26700
where R1 = RTD resistance at (TMIN + TMAX)/2
R2 = RTD resistance at TMAX
RLIN = 1kΩ (Internal)
EXAMPLE:
The measurement range is –100°C to +200°C for a 3-wire Pt100 RTD connection. Determine the values for RS, RG, RLIN1, and RLIN2. Look up the values
from the chart or calculate the values according to the equations provided.
METHOD 1: TABLE LOOK UP
For TMIN = –100°C and ∆T = –300°C, the 1% values are:
RZ = 60.4Ω
RG = 243Ω
RLIN1 = 10.5kΩ
RLIN2 = 13kΩ
Calculation of Pt100 Resistance Values
METHOD 2: CALCULATION
(according to DIN IEC 751)
Step 1: Determine RZ, R1, and R2.
Equation (1) Temperature range from –200°C to 0°C:
RZ is the RTD resistance at the minimum measured temperature,TMIN = –100°C.
Using equation (1) at right gives RZ = 60.25Ω (1% value is 60.4Ω).
R(T) = 100 [1 + 3.90802 • 10–3 • T – 0.5802 • 10–6
T2 – 4.27350 • 10–12 (T – 100) T3]
•
R2 is the RTD resistance at the maximum measured temperature, TMAX = 200°C.
Using equation (2) at right gives R2 = 175.84Ω.
Equation (2) Temperature range from 0°C to +850°C:
R1 is the RTD resistance at the midpoint measured temperature,
TMID = (TMIN + TMAX)/2 = 50°C. R1 is NOT the average of RZ and R2.
Using equation (2) at right gives R1 = 119.40Ω.
R(T) = 100 (1 + 3.90802 • 10–3 • T – 0.5802 • 10–6 • T2)
where: R(T) is the resistance in Ω at temperature T.
T is the temperature in °C.
Step 2: Calculate RG, RLIN1, and RLIN2 using equations above.
NOTE: Most RTD manufacturers provide reference tables for
resistance values at various temperatures.
RG = 242.3Ω (1% value is 243Ω)
RLIN1 = 10.413kΩ (1% value is 10.5kΩ)
RLIN2 = 12.936kΩ (1% value is 13kΩ)
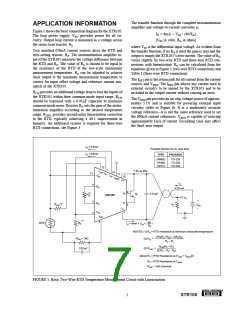
TABLE I. RZ, RG, RLIN1, and RLIN2 Standard 1% Resistor Values for Three-Wire Pt100 RTD Connection with Linearization.
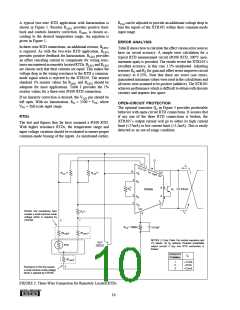
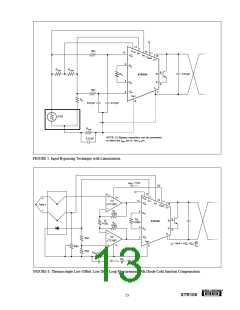
LINEARIZATION
RTD temperature sensors are inherently (but predictably)
To maintain good accuracy, at least 1% (or better) resistors
should be used for RG. Table I provides standard 1% RG
nonlinear. With the addition of one or two external resistors,
resistor values for a three-wire Pt100 RTD connection with
R
LIN1 and RLIN2, it is possible to compensate for most of this
linearization.
nonlinearity resulting in 40:1 improvement in linearity over
the uncompensated output.
®
XTR105
9

 BB [ BURR-BROWN CORPORATION ]