PCM3793A
PCM3794A
www.ti.com
SLAS529A–JANUARY 2007–REVISED FEBRUARY 2007
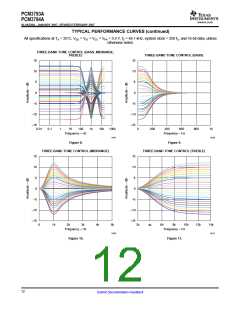
TYPICAL PERFORMANCE CURVES (continued)
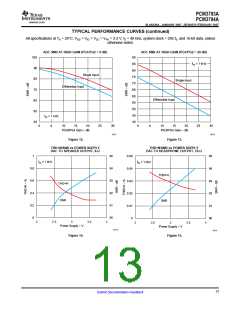
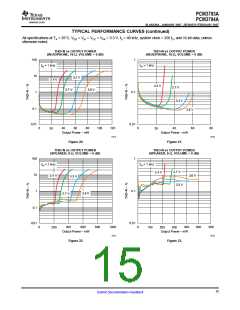
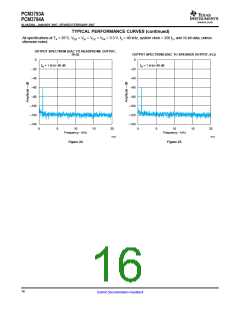
All specifications at TA = 25°C, VDD = VIO = VCC = VPA = 3.3 V, fS = 48 kHz, system clock = 256 fS, and 16-bit data, unless
otherwise noted.
ADC SNR AT HIGH GAIN (PG1/PG2 = 0 dB)
ADC SNR AT HIGH GAIN (PG1/PG2 = 20 dB)
100
90
85
70
60
50
40
90
85
80
75
70
65
60
55
50
45
40
fIN = 1 kHz
Single Input
Single Input
Differential Input
Differential Input
fIN = 1 kHz
0
25
30
0
25
30
10
15
20
10
15
20
5
5
PG3/PG4 Gain – dB
PG3/PG4 Gain – dB
G011
G012
Figure 12.
Figure 13.
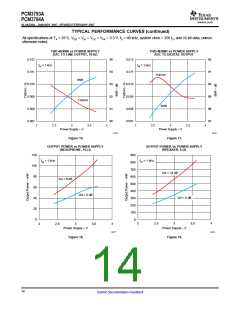
THD+N/SNR vs POWER SUPPLY
DAC TO SPEAKER OUTPUT, 8-Ω
THD+N/SNR vs POWER SUPPLY
DAC TO HEADPHONE OUTPUT, 16-Ω
1
95
0.05
95
94
93
92
91
90
fIN = 1 kHz
fIN = 1 kHz
0.8
94
93
92
91
90
0.04
0.03
0.02
0.01
0
THD+N
0.6
0.4
0.2
0
THD+N
SNR
SNR
2
2.5
3
3.5
4
2
2.5
3
3.5
4
Power Supply – V
Power Supply – V
G013
G014
Figure 14.
Figure 15.
13
Submit Documentation Feedback

 BB [ BURR-BROWN CORPORATION ]