Isolated, Digital Output, Power Monitoring IC
with Zero-Crossing Detection, Overcurrent and Overvoltage Flagging
ACS37800
THERMAL PERFORMANCE
The thermal capacity of the ACS37800 should be verified by the
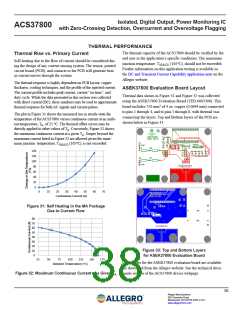
Thermal Rise vs. Primary Current
end user in the application’s specific conditions. The maximum
junction temperature, TJ(MAX) (165℃), should not be exceeded.
Further information on this application testing is available in
the DC and Transient Current Capability application note on the
Allegro website.
Self-heating due to the flow of current should be considered dur-
ing the design of any current sensing system. The sensor, printed
circuit board (PCB), and contacts to the PCB will generate heat
as current moves through the system.
The thermal response is highly dependent on PCB layout, copper
thickness, cooling techniques, and the profile of the injected current.
The current profile includes peak current, current “on-time”, and
duty cycle. While the data presented in this section was collected
with direct current (DC), these numbers may be used to approximate
thermal response for both AC signals and current pulses.
ASEK37800 Evaluation Board Layout
Thermal data shown in Figure 31 and Figure 32 was collected
using the ASEK37800 Evaluation Board (TED-0003306). This
board includes 750 mm2 of 4 oz. copper (0.0694 mm) connected
to pins 1 through 4, and to pins 5 through 8, with thermal vias
connecting the layers. Top and Bottom layers of the PCB are
shown below in Figure 33.
The plot in Figure 31 shows the measured rise in steady-state die
temperature of the ACS37800 versus continuous current at an ambi-
ent temperature, TA, of 25 °C. The thermal offset curves may be
directly applied to other values of TA. Conversely, Figure 32 shows
the maximum continuous current at a given TA. Surges beyond the
maximum current listed in Figure 32 are allowed given the maxi-
mum junction temperature, TJ(MAX) (165℃), is not exceeded.
140
120
100
80
60
40
20
0
0
10
20
30
40
50
60
70
Continuous Current ꢂꢅꢄ
Figure 31: Self Heating in the MA Package
Due to Current Flow
80
70
60
50
40
30
20
10
0
Figure 33: Top and Bottom Layers
for ASEK37800 Evaluation Board
25
50
75
100
125
150
175
Gerber files for the ASEK37800 evaluation board are available
for download from the Allegro website. See the technical docu-
ꢁꢃꢄient ꢅeꢃperature ꢀ°Cꢂ
Figure 32: Maximum Continuous Current at a Given TA ments section of the ACS37800 device webpage.
38
Allegro MicroSystems
955 Perimeter Road
Manchester, NH 03103-3353 U.S.A.
www.allegromicro.com

 ALLEGRO [ ALLEGRO MICROSYSTEMS ]