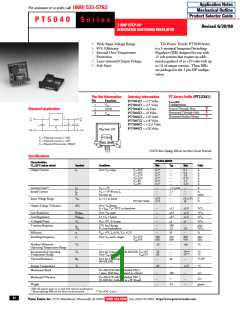
For assistance or to order, call (800) 531-5782
P T 5 0 4 0 S e r i e s
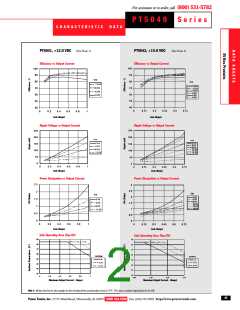
C H A R A C T E R I S T I C
D A T A
PT5041, +12.0 VDC
(See Note 1)
PT5042, +15.0 VDC
(See Note 1)
Efficiency vs Output Current
Efficiency vs Output Current
100
90
80
70
60
50
40
100
90
80
70
60
50
40
Vin
11.0V
Vin
14.0V
12.0V
10.0V
8.0V
8.0V
6.0V
5.0V
6.0V
5.0V
0
0.15
0.3
0.45
0.6
0.75
0
0.2
0.4
0.6
0.8
1
Iout-(Amps)
Iout-(Amps)
Ripple Voltage vs Output Current
Ripple Voltage vs Output Current
250
200
150
100
50
250
200
150
100
50
V in
Vin
5.0V
6.0V
8.0V
11.0V
5.0V
6.0V
8.0V
10.0V
12.0V
14.0V
0
0
0
0.2
0.4
0.6
0.8
1
0
0.15
0.3
0.45
0.6
0.75
Iout-(Amps)
Iout-(Amps)
Power Dissipation vs Output Current
Power Dissipation vs Output Current
2.5
2
3
2.5
2
Vin
Vin
5.0V
6.0V
8.0V
10.0V
12.0V
14.0V
1.5
1
5.0V
6.0V
8.0V
11.0V
1.5
1
0.5
0
0.5
0
0
0.2
0.4
0.6
0.8
1
0
0.15
0.3
0.45
0.6
0.75
Iout-(Amps)
Iout-(Amps)
Safe Operating Area (VIN=5V)
Safe Operating Area (VIN=5V)
90
80
70
60
50
40
30
20
90
80
70
60
50
40
30
20
Airflow
0 LFM
Airflow
0
LFM
60 LFM
90 LFM
60 LFM
90 LFM
0
0.2
0.4
0.6
0.8
1
0.00
0.25
0.50
0.75
Maximum Output Current - (Amps)
Maximum Output Current - (Amps)
Note 1: All data listed in the above graphs has been developed from actual products tested at 25°C. This data is considered typical data for the ISR.
45
Power Trends, Inc. 27715 Diehl Road, Warrenville, IL 60555 (800) 531-5782 Fax: (630) 393-6902 http://www.powertrends.com

 TI [ TEXAS INSTRUMENTS ]