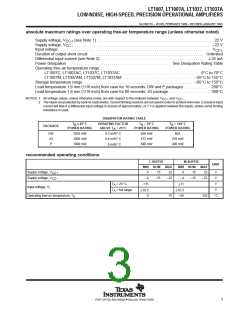
LT1007, LT1007A, LT1037, LT1037A
LOW-NOISE, HIGH-SPEED, PRECISION OPERATIONAL AMPLIFIERS
SLOS017C – D3195, FEBRUARY 1989 – REVISED JANUARY 1993
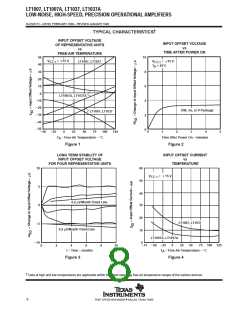
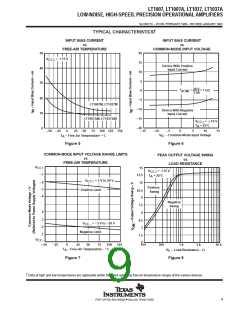
TYPICAL CHARACTERISTICS
table of graphs
FIGURE
V
IO
Input offset voltage
vs Temperature
1
vs Time after power on
vs Time (long-term stability)
2
3
∆V
Change in input offset voltage
Input offset current
IO
I
I
vs Temperature
4
IO
vs Temperature
over common-mode range
5
6
Input bias current
IB
Common-mode limit voltage
vs Free-air temperature
7
Maximum peak output voltage
swing
vs Load resistance
vs Frequency
8
9
V
OM
vs Frequency
10
11
12
13
14
15
16
vs Frequency (LT1007)
vs Frequency (LT1037)
vs Temperature
vs Load resistance
vs Supply voltage
at 2 kΩ and 600 Ω
Differential voltage amplifica-
tion
A
VD
V
Differential input voltage
vs Output voltage
vs Frequency
vs Frequency
16
17
18
ID
CMRR Common-mode rejection ratio
k
Supply voltage rejection ratio
SVR
vs Free-air temperature (LT1007)
vs Free-air temperature (LT1037)
19
20
SR
Slew rate
vs Frequency (LT1007)
vs Frequency (LT1037)
11
12
φ
Phase shift
vs Free-air temperature (LT1007)
vs Free-air temperature (LT1037)
19
20
φ
m
Phase margin
vs Free-air temperature
vs Time (0.01-Hz to 1-Hz noise)
vs Frequency
vs Bandwidth
vs Supply voltage
21
22
23
24
25
V
n
Equivalent input noise voltage
Equivalent input noise current
Total noise
vs Frequency
vs Source resistance
26
27
I
n
vs Free-air Temperature (LT1007)
vs Free-air Temperature (LT1037)
19
20
GBW
Gain bandwidth product
I
I
Short-circuit output current
Supply current
vs Time (from short to GND)
vs Supply voltage
28
29
30
OS
CC
z
Closed-loop output impedance
vs Frequency
o
Small-signal (C = 15 pF)
L
31
32
Pulse response (LT1037)
Pulse response (LT1007)
Large-signal
Small-signal (C = 15 pF)
L
33
34
Large-signal
7
POST OFFICE BOX 655303 • DALLAS, TEXAS 75265

 TI [ TEXAS INSTRUMENTS ]