ADS7056
www.ti.com.cn
ZHCSG66 –MARCH 2017
Table 5 lists the acquisition time for the above two cases for a throughput of 10 kSPS. Clearly, case 2 provides
more acquisition time for the input signal to settle.
Table 5. Acquisition Time with Different SCLK Frequencies
CONVERSION TIME
ACQUISITION TIME
CASE
SCLK
tcycle
(= 18 × tSCLK
)
(= tcycle – tconv
)
1
2
0.24 MHz
60 MHz
100 µs
100 µs
75 µs
25 µs
0.3 µs
99.7 µs
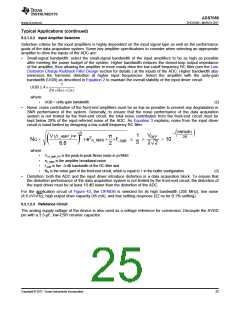
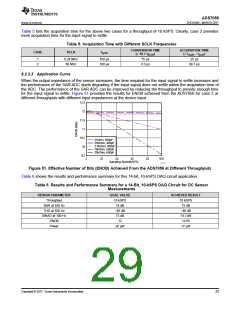
9.2.3.3 Application Curve
When the output impedance of the sensor increases, the time required for the input signal to settle increases and
the performance of the SAR ADC starts degrading if the input signal does not settle within the acquisition time of
the ADC. The performance of the SAR ADC can be improved by reducing the throughput to provide enough time
for the input signal to settle. Figure 51 provides the results for ENOB achieved from the ADS7056 for case 2 at
different throughputs with different input impedances at the device input.
12.5
12
11.5
11
10.5
33Ohm, 680pF
330Ohm, 680pF
3.3kOhm, 680pF
10kOhm, 680pF
20kOhm, 680pF
10
9.5
2
22
42
62
82
100
Sampling Speed(kSPS)
D039
Figure 51. Effective Number of Bits (ENOB) Achieved From the ADS7056 at Different Throughputs
Table 6 shows the results and performance summary for this 14-bit, 10-kSPS DAQ circuit application.
Table 6. Results and Performance Summary for a 14-Bit, 10-kSPS DAQ Circuit for DC Sensor
Measurements
DESIGN PARAMETER
Throughput
GOAL VALUE
10 kSPS
74 dB
ACHIEVED RESULT
10 kSPS
75 dB
SNR at 100 Hz
THD at 100 Hz
SINAD at 100 Hz
ENOB
–85 dB
73 dB
–89 dB
74.3 dB
12
12.05
Power
20 µW
17 µW
Copyright © 2017, Texas Instruments Incorporated
29

 TI [ TEXAS INSTRUMENTS ]