Overvoltage Protection Comparison
dv/dt Chart
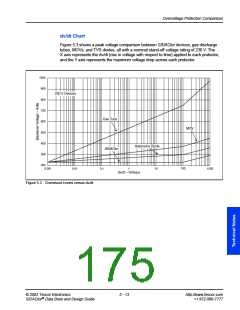
Figure 5.3 shows a peak voltage comparison between SIDACtor devices, gas discharge
tubes, MOVs, and TVS diodes, all with a nominal stand-off voltage rating of 230 V. The
X axis represents the dv/dt (rise in voltage with respect to time) applied to each protector,
and the Y axis represents the maximum voltage drop across each protector.
1000
900
800
700
600
230 V Devices
Gas Tube
MOV
500
400
300
200
Avalanche Diode
SIDACtor
100
1000
0.001
0.01
0.1
1
10
dv/dt – Volts/µs
Figure 5.3 Overshoot Levels versus dv/dt
© 2002 Teccor Electronics
5 - 13
http://www.teccor.com
+1 972-580-7777
®
SIDACtor Data Book and Design Guide

 TECCOR [ TECCOR ELECTRONICS ]