Technical
Specification
IQ18-QTC Family
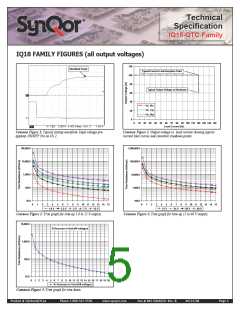
IQ18 FꢂMIꢃꢄ FIGURꢁS (all output voltages)
120
Nominal Vout
Typical Current Limit Inception Point
100
80
60
40
20
0
Typical Output Voltage at Shutdown
Vin, Min.
Vin, Typ.
Vin, Max.
0
10 20 30 40 50 60 70 80 90 100 110 120 130 140 150
Load Current (%)
Common Figure 1: Typical startup waveform. Input voltage pre-
Common Figure 2: Output voltage vs. load current showing typical
applied, ON/OFF Pin on Ch 2.
current limit curves and converter shutdown points.
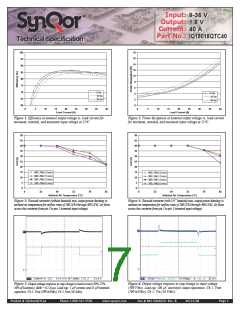
100,000.0
10,000.0
1,000.0
100.0
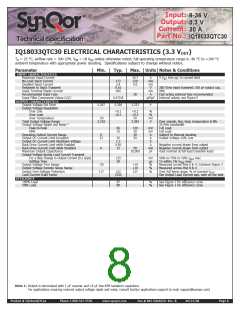
1,000,000.0
100,000.0
10,000.0
1,000.0
10.0
100.0
0
1
2
3
4
5
6
7
8
9
10 11 12 13 14 15
7 V 12 V
0
1
2
3
4
5
6
7
8
9
10 11 12 13 14 15
1.8 V
3.3 V
5 V
15 V
24 V
30 V 48 V
Common Figure 3: Trim graph for trim-up 1.8 to 12 V outputs.
Common Figure 4: Trim graph for trim-up 15 to 48 V outputs.
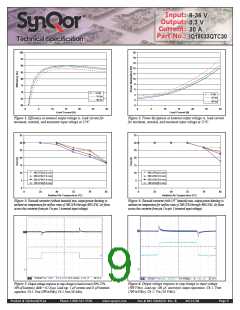
10,000.0
% Decrease in Vout (All voltages)
1,000.0
100.0
10.0
0
1
2
3
4
5
6
7
8
9
10 11 12 13 14 15 16 17 18 19 20
% Decrease in Vout (All voltages)
Common Figure 5: Trim graph for trim down.
Product # IQ18xxxQTCxx
Phone 1-888-567-9596
www.synqor.com
Doc.# 005-IQ18QTX Rev. B
09/23/08
Page 5

 SYNQOR [ SYNQOR WORLDWIDE HEADQUARTERS ]