List of figures
TDA7850
List of figures
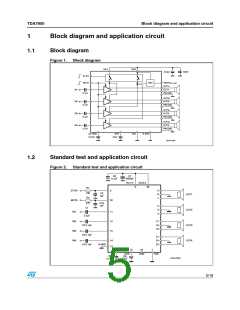
Figure 1.
Figure 2.
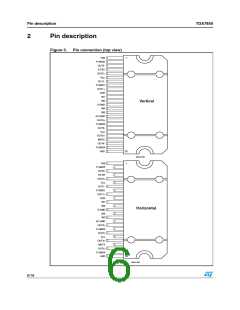
Figure 3.
Figure 4.
Figure 5.
Figure 6.
Figure 7.
Figure 8.
Figure 9.
Block diagram . . . . . . . . . . . . . . . . . . . . . . . . . . . . . . . . . . . . . . . . . . . . . . . . . . . . . . . . . . . . 5
Standard test and application circuit. . . . . . . . . . . . . . . . . . . . . . . . . . . . . . . . . . . . . . . . . . . 5
Pin connection (top view) . . . . . . . . . . . . . . . . . . . . . . . . . . . . . . . . . . . . . . . . . . . . . . . . . . . 6
Components and top copper layer of the Figure 2. . . . . . . . . . . . . . . . . . . . . . . . . . . . . . . 10
Bottom copper layer Figure 2. . . . . . . . . . . . . . . . . . . . . . . . . . . . . . . . . . . . . . . . . . . . . . . 10
Quiescent current vs. supply voltage . . . . . . . . . . . . . . . . . . . . . . . . . . . . . . . . . . . . . . . . . 11
Output power vs. supply voltage (R = 4Ω) . . . . . . . . . . . . . . . . . . . . . . . . . . . . . . . . . . . . 11
L
Output power vs. supply voltage (R = 2Ω) . . . . . . . . . . . . . . . . . . . . . . . . . . . . . . . . . . . . 11
L
Distortion vs. output power (R = 4Ω). . . . . . . . . . . . . . . . . . . . . . . . . . . . . . . . . . . . . . . . . 11
L
Figure 10. Distortion vs. output power (R = 2Ω). . . . . . . . . . . . . . . . . . . . . . . . . . . . . . . . . . . . . . . . . 11
L
Figure 11. Distortion vs. frequency (R = 4Ω) . . . . . . . . . . . . . . . . . . . . . . . . . . . . . . . . . . . . . . . . . . . 11
L
Figure 12. Distortion vs. frequency (R = 2Ω) . . . . . . . . . . . . . . . . . . . . . . . . . . . . . . . . . . . . . . . . . . . 12
L
Figure 13. Crosstalk vs. frequency . . . . . . . . . . . . . . . . . . . . . . . . . . . . . . . . . . . . . . . . . . . . . . . . . . . 12
Figure 14. Supply voltage rejection vs. frequency . . . . . . . . . . . . . . . . . . . . . . . . . . . . . . . . . . . . . . . . 12
Figure 15. Output attenuation vs. supply voltage. . . . . . . . . . . . . . . . . . . . . . . . . . . . . . . . . . . . . . . . . 12
Figure 16. Power dissipation & efficiency vs. output power (R = 4Ω, SINE) . . . . . . . . . . . . . . . . . . . 12
L
Figure 17. Power dissipation & efficiency vs. output power (R = 2Ω, SINE) . . . . . . . . . . . . . . . . . . . 12
L
Figure 18. Power dissipation vs. output power (R = 4Ω, audio program simulation) . . . . . . . . . . . . . 13
L
Figure 19. Power dissipation vs. output power (R = 2Ω, audio program simulation) . . . . . . . . . . . . . 13
L
Figure 20. ITU R-ARM frequency response, weighting filter for transient pop. . . . . . . . . . . . . . . . . . . 13
Figure 21. Flexiwatt25 (vertical) mechanical data and package dimensions. . . . . . . . . . . . . . . . . . . . 15
Figure 22. Flexiwatt25 (horizontal) mechanical data and package dimensions. . . . . . . . . . . . . . . . . . 16
4/18

 STMICROELECTRONICS [ ST ]