BTA40 and BTA/BTB41 Series
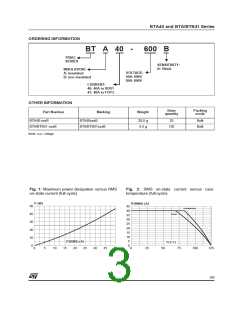
Fig. 3: Relative variation of thermal impedance
Fig. 4: On-state characteristics (maximum
versus pulse duration.
values).
ITM (A)
K=[Zth/Rth]
400
1E+0
Zth(j-c)
Tj max
100
1E-1
Zth(j-a)
BTA/BTB41
Tj=25°C
10
1E-2
Tj max.:
Vto = 0.85V
Rd = 10 mΩ
tp (s)
VTM (V)
1E-3
1
1E-3
1E-2
1E-1
1E+0
1E+1
1E+2 5E+2
0.5 1.0 1.5 2.0 2.5 3.0 3.5 4.0 4.5 5.0
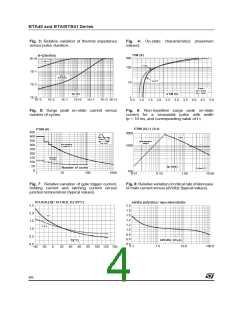
Fig. 5: Surge peak on-state current versus
number of cycles.
Fig. 6: Non-repetitive surge peak on-state
current for a sinusoidal pulse with width
tp < 10 ms, and corresponding value of I t.
ITSM (A),I t (A s)
ITSM (A)
450
3000
400
ITSM
t=20ms
350
dI/dt limitation:
50A/µs
One cycle
Non repetitive
Tj initial=25°C
I t
300
1000
250
200
Repetitive
Tc=70°C
150
100
50
tp (ms)
Number of cycles
Tj initial=25°C
0
100
1
10
100
1000
0.01
0.10
1.00
10.00
Fig. 7: Relative variation of gate trigger current,
holding current and latching current versus
junction temperature (typical values).
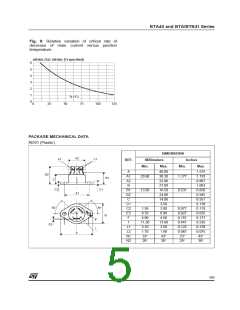
Fig. 8: Relative variation ofcritical rate ofdecrease
of main currentversus (dV/dt)c (typical values).
IGT,IH,IL[Tj]/ IGT,IH,IL [Tj=25°C]
(dI/dt)c [(dV/dt)c] / Specified (dI/dt)c
2.5
2.0
1.8
1.6
1.4
1.2
1.0
0.8
2.0
IGT
1.5
IH & IL
1.0
0.5
0.6
0.4
(dV/dt)c (V/µs)
1.0 10.0
Tj(°C)
40 60
0.0
-40 -20
0.1
100.0
0
20
80 100 120 140
4/6

 STMICROELECTRONICS [ ST ]