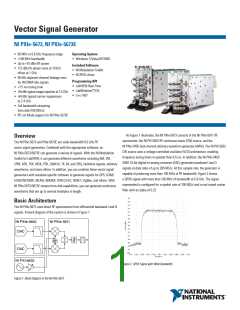
Vector Signal Generator
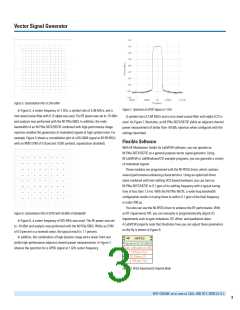
Figure 5. Constellation Plot of 256-QAM
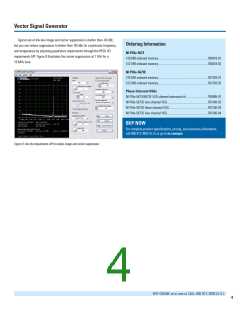
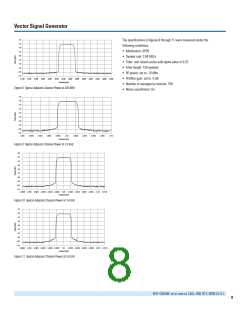
Figure 7. Spectrum of QPSK Signal at 1 GHz
In Figure 5, a center frequency of 1 GHz, a symbol rate of 5.36 MS/s, and a
root raised cosine filter with 0.12 alpha was used. The RF power was set to -10 dBm
and analysis was performed with the NI PXIe-5663. In addition, the wide
bandwidth of an NI PXIe-5673/5673E combined with high-performance image
rejection enabled the generation of modulated signals at high symbol rates. For
example, Figure 5 shows a constellation plot of a 64-QAM signal at 40.99 MS/s
with an RMS EVM of 0.9 percent (1250 symbols, equalization disabled).
A symbol rate of 3.84 MS/s and a root raised cosine filter with alpha 0.22 is
used. As Figure 7 illustrates, an NI PXIe-5673/5673E yields an adjacent channel
power measurement of better than -69 dBc rejection when configured with the
settings described.
Flexible Software
With NI Modulation Toolkit for LabVIEW software, you can operate an
NI PXIe-5673/5673E as a general-purpose vector signal generator. Using
NI LabVIEW or LabWindows/CVI example programs, you can generate a variety
of modulated signals.
These modules are programmed with the NI-RFSG driver, which contains
several performance-enhancing characteristics. Using an optimized driver
stack combined with fast-settling VCO-based hardware, you can tune an
NI PXIe-5673/5673E to 0.1 ppm of its settling frequency with a typical tuning
time of less than 1.5 ms. With the NI PXIe-5673E, a wide-loop bandwidth
configuration results in tuning times to within 0.1 ppm of the final frequency
in under 300 µs.
You also can use the NI-RFSG driver to enhance the RF performance. With
an RF impairments API, you can manually or programmatically adjust I/Q
impairments such as gain imbalance, DC offset, and quadrature skew.
A LabVIEW property node that illustrates how you can adjust these parameters
on the fly is shown in Figure 8.
Figure 6. Constellation Plot of QPSK with 50 MHz of Bandwidth
In Figure 6, a center frequency of 825 MHz was used. The RF power was set
to -10 dBm and analysis was performed with the NI PXIe-5663. While an EVM
of 0.9 percent is a nominal value, the typical result is 1.1 percent.
In addition, the combination of high dynamic range and a linear front end
yields high-performance adjacent channel power measurements. In Figure 7,
observe the spectrum for a QPSK signal at 1 GHz center frequency.
Figure 8. RFSG Impairments Property Node
BUY ONLINE at ni.com or CALL 800 813 3693 (U.S.)
3

 NI [ National Instruments ]