1N821UR thru 1N829AUR-1
(or MLL821 thru MLL829-1)
6.2 & 6.55 Volt Temperature Compensated
Surface Mount Zener Reference Diodes
S C O T T S D A L E D I V I S I O N
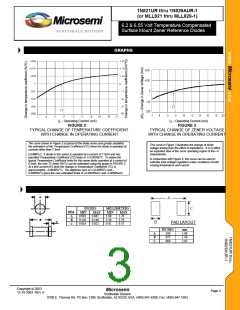
GRAPHS
I – Operating Current (mA)
I – OpFerIaGtinUgRCEurr2ent (mA)
FIGURE 3
Z
Z
TYPICAL CHANGE OF TEMPERATURE COEFFICIENT
WITH CHANGE IN OPERATING CURRENT.
TYPICAL CHANGE OF ZENER VOLTAGE
WITH CHANGE IN OPERATING CURRENT
The curve shown in Figure 2 is typical of the diode series and greatly simplifies
the estimation of the Temperature Coefficient (TC) when the diode is operated at
currents other than 7.5mA.
EXAMPLE: A diode in this series is operated at a current of 7.5mA and has
specified Temperature Coefficient (TC) limits of +/-0.005%/oC. To obtain the
typical Temperature Coefficient limits for this same diode operated at a current of
6.0mA, the new TC limits (%/oC) can be estimated using the graph in FIGURE 2.
At a test current of 6.0mA the change in Temperature Coefficient (TC) is
approximately –0.0006%.oC. The algebraic sum of +/-0.005%oC and –
0.0006%/oC gives the new estimated limits of +0.0044%/oC and -0.0056%/oC.
This curve in Figure 3 illustrates the change of diode
voltage arising from the effect of impedance. It is in effect
an exploded view of the zener operating region of the I-V
characteristic.
In conjunction with Figure 2, this curve can be used to
estimate total voltage regulation under conditions of both
varying temperature and current.
PACKAGE DIMENSIONS
INCHES
MILLIMETERS
MIN MAX
DIM
A
MIN
MAX
0.067
0.146
0.022
0.063
0.130
0.016
1.60
1.70
3.30
0.41
3.70
0.55
B
PAD LAYOUT
C
INCHES
.200
mm
5.08
1.40
2.03
A
B
C
.055
.080
Copyright 2003
Microsemi
Page 3
12-19-2003 REV A
Scottsdale Division
8700 E. Thomas Rd. PO Box 1390, Scottsdale, AZ 85252 USA, (480) 941-6300, Fax: (480) 947-1503

 MICROSEMI [ Microsemi ]