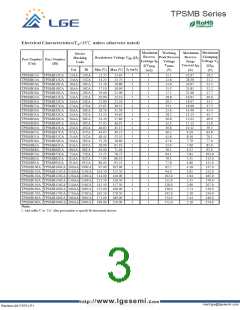
TPSMB Series
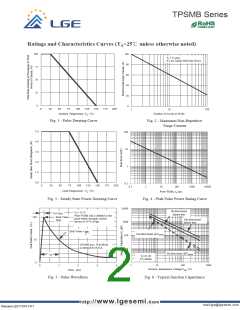
Ratings and Characteristics Curves (TA=25℃ unless otherwise noted)
AVERAGE FORWARD CURRENT, (A)
AMBIEN
100
100
80
60
40
20
0
TJ = TJ max.
8.3 ms Single Half Sine-Wave
22
0
100
100
1
10
0
25
100
75
150
0
50
25
0
0
25
50
75
100
125
150
175
200
1
10
100
Number of Cycles at 60 Hz
Ambient Temperature ,TA (℃)
Fig. 1 - Pulse Derating Curve
Fig. 2 - Maximum Non-Repetitive
Surge Current
5.0
4.0
3.0
2.0
1.0
0.0
100
10
1
0
73
##
5
0.1
30
5
0
10000
0.22
0.1
0
25
50
75
100
125
150
175
200
0.1
1
10
100
1000
10000
Lead Temperature , TL (℃)
Pulse Width ,td (μs)
Fig. 3 - Steady State Power Derating Curve
Fig. 4 - Peak Pulse Power Rating Curve
10000
1000
100
10
Bi-directional
@zero bias
TJ = 25 °C
Tr=10μs
5
4000
5
450
70
Pulse Width (td) is defined as the
Peak Value
(Ipp)
100
point where the peak current
Uni-directional
@zero bias
de0cays to 50 % of Ipp
0
450
40
0.2
0.5
100
2800
76
Half Value = Ipp
Uni-directional @VRWM
2 50
5
2500
5
450
1
1.5
2
50
7
33
10/1000 μsec. Waveform
as defined by R.E.A.
450
10
23
2000
3
13
10
Bi-directional @VRWM
td
TJ=25
f=1.0MHz
C
4
1
0
1
10
100
1000
0
1
2
3
4
Reverse Breakdown Voltage,VBR (V)
Time , (ms)
Fig. 5 - Pulse Waveform
Fig. 6 - Typical Junction Capacitance
http://www.lgesemi.com
mail:lge@lgesemi.com
Revision:20170701-P1

 LGE [ LGE ]