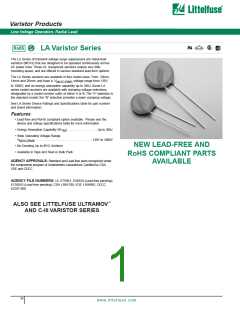
Varistor Products
Line Voltage Operation, Radial Lead
Pb
RoHS
LA Varistor Series
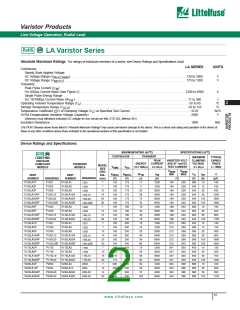
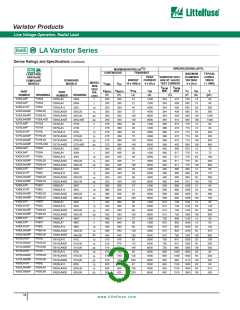
Device Ratings and Specifications (Continued)
o
o
MAXIMUM RATING (85 C)
CONTINUOUS TRANSIENT
PEAK
SPECIFICATIONS (25 C)
RoHS Pb
LEAD-FREE
AND RoHS
COMPLIANT
MODELS
MAXIMUM
TYPICAL
CAPACI-
TANCE
VARISTOR VOLT-
AGE AT 1mA DC
TEST CURRENT
CLAMPING
VOLTAGE
8 x 20µs
ENERGY
CURRENT
STANDARD
MODELS
MODEL
SIZE
DISC
DIA.
V
V
10 x 1000µs
8 x 20µs
f = 1MHz
RMS
DC
V
MIN
V
NOM
MAX
NOM
V
V
W
I
V
I
PK
C
(pF)
70
M(AC)
(V)
M(DC)
(V)
TM
(J)
TM
C
PART
PART
BRANDING
P660L
BRANDING
660L
(A)
(V)
(V)
(A)
25
NUMBER
V660LA10P
V660LA50AP
NUMBER
(mm)
V660LA10
10
14
20
14
20
660
660
850
850
70
2500
4500
6500
4500
6500
940
940
1210
1210
1100
1800
1600
1820
1820
1650
2700
2420
2
P660L50
V660LA50A
660L50
140
250
220
360
50
200
400
130
250
V660LA100BP P660L100 V660LA100B
V1000LA80AP P1000L8
V1000LA80A
V1000LA160BP P1000L16 V1000LA160B
660L100
1000L80
1000L160
660
850
940
100
50
1000
1000
1200
1200
1425
1425
100
NOTE: Average power dissipation of transients not to exceed 0.25W, 0.4W, 0.6W or 1W for model sizes 7mm, 10mm, 14mm and 20mm, respectively.
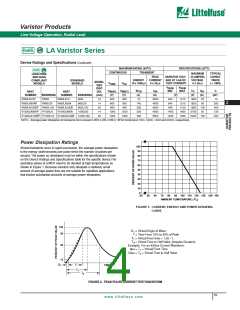
Power Dissipation Ratings
100
Should transients occur in rapid succession, the average power dissipation
90
is the energy (watt-seconds) per pulse times the number of pulses per
second. The power so developed must be within the specifications shown
on the Device Ratings and Specifications table for the specific device.The
operating values of a MOV need to be derated at high temperatures as
shown in Figure 1. Because varistors only dissipate a relatively small
amount of average power they are not suitable for repetitive applications
that involve substantial amounts of average power dissipation.
80
70
60
50
40
30
20
10
0
-55
50
60
70
80
90 100 110 120 130 140 150
o
AMBIENT TEMPERATURE ( C)
FIGURE 1. CURRENT, ENERGY AND POWER DERATING
CURVE
100
90
O
= Virtual Origin of Wave
1
T = Time From 10% to 90% of Peak
T
T
= Virtual Front time = 1.25 • t
= Virtual Time to Half Value (Impulse Duration)
1
2
50
Example: For an 8/20µs Current Waveform:
8µs = T = Virtual Front Time
1
20µs = T = Virtual Time to Half Value
2
10
O
1
T
TIME
T
1
T
2
FIGURE 2. PEAK PULSE CURRENT TEST WAVEFORM
59
www. lit t elf us e. c om

 LITTELFUSE [ LITTELFUSE ]